A tour of the dashboard
What a rig looks like once it has boards and a week of work behind it. Every picture on this page is the real dashboard, taken of a demo rig: four boards on a powered hub, three projects, a CI key and a person running suites. The names, runs and boards are made up; the recipe is at the bottom, and anyone can take them again.
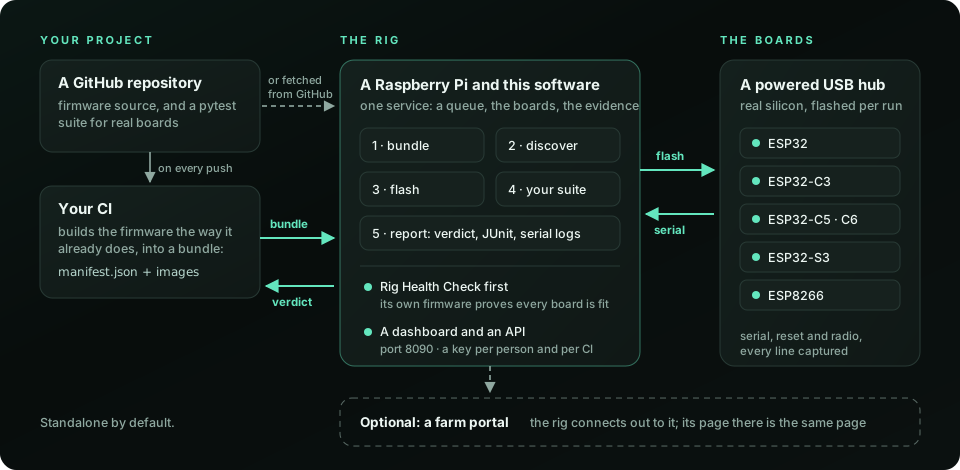
Overview: the rig at a glance
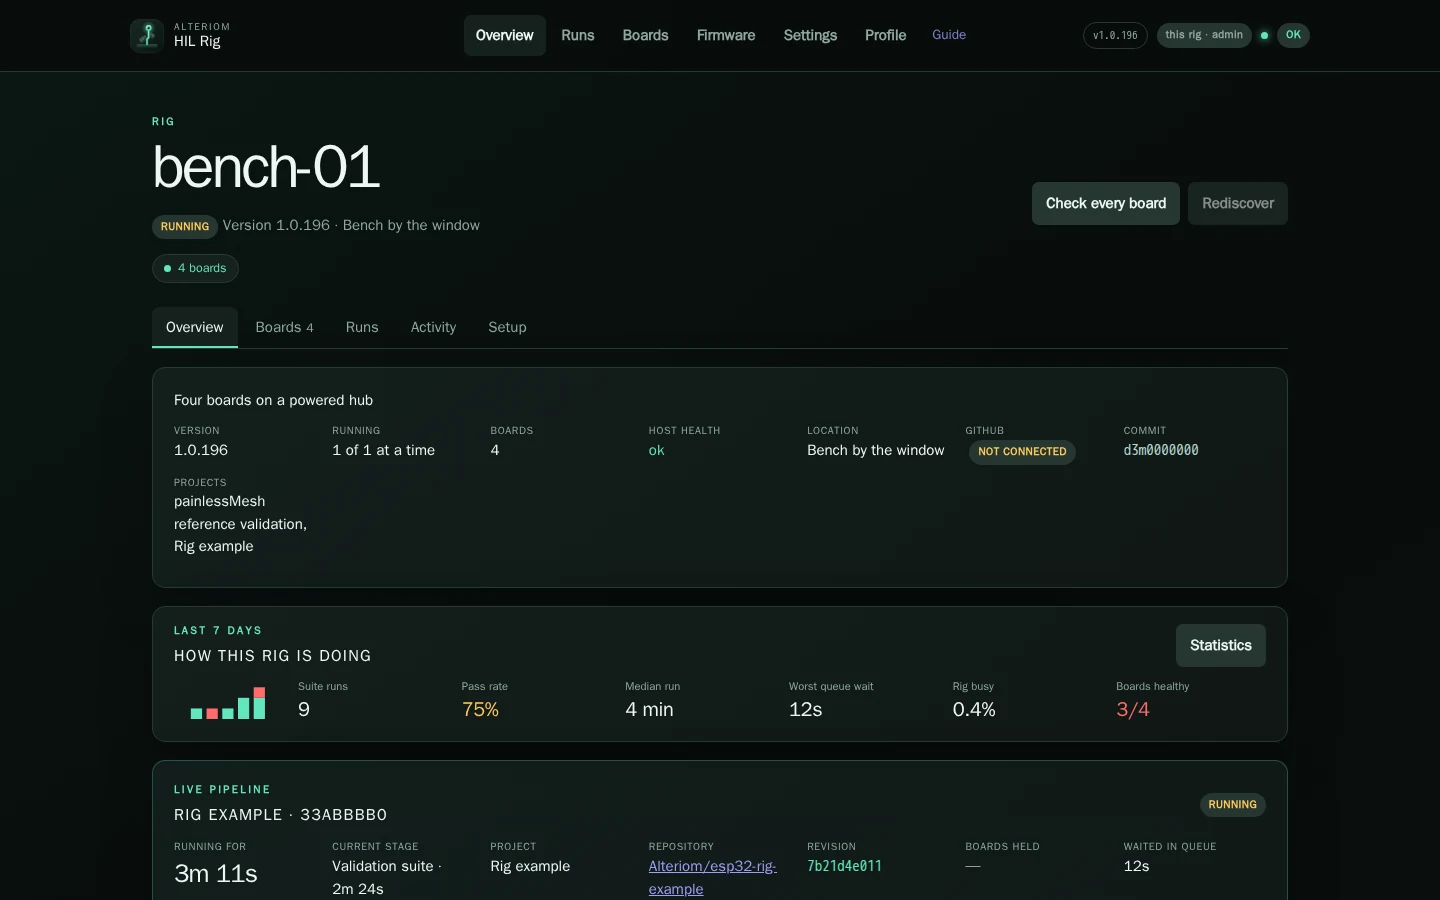
The rig's own page. Its name is the host's; the description and location are yours, from Settings → Rig. Under them, the facts that answer "is this rig fine": the version installed, how many runs it takes at a time, its boards, the host's health, whether GitHub is connected and which projects it runs.
How this rig is doing is the last seven days in one line: suite runs per day, the pass rate, the median run, the worst wait in the queue, how busy the rig was and how many boards passed their last health check. Statistics opens the whole picture. Below it, the run in progress, stage by stage, as it happens.
Runs: every run, newest first
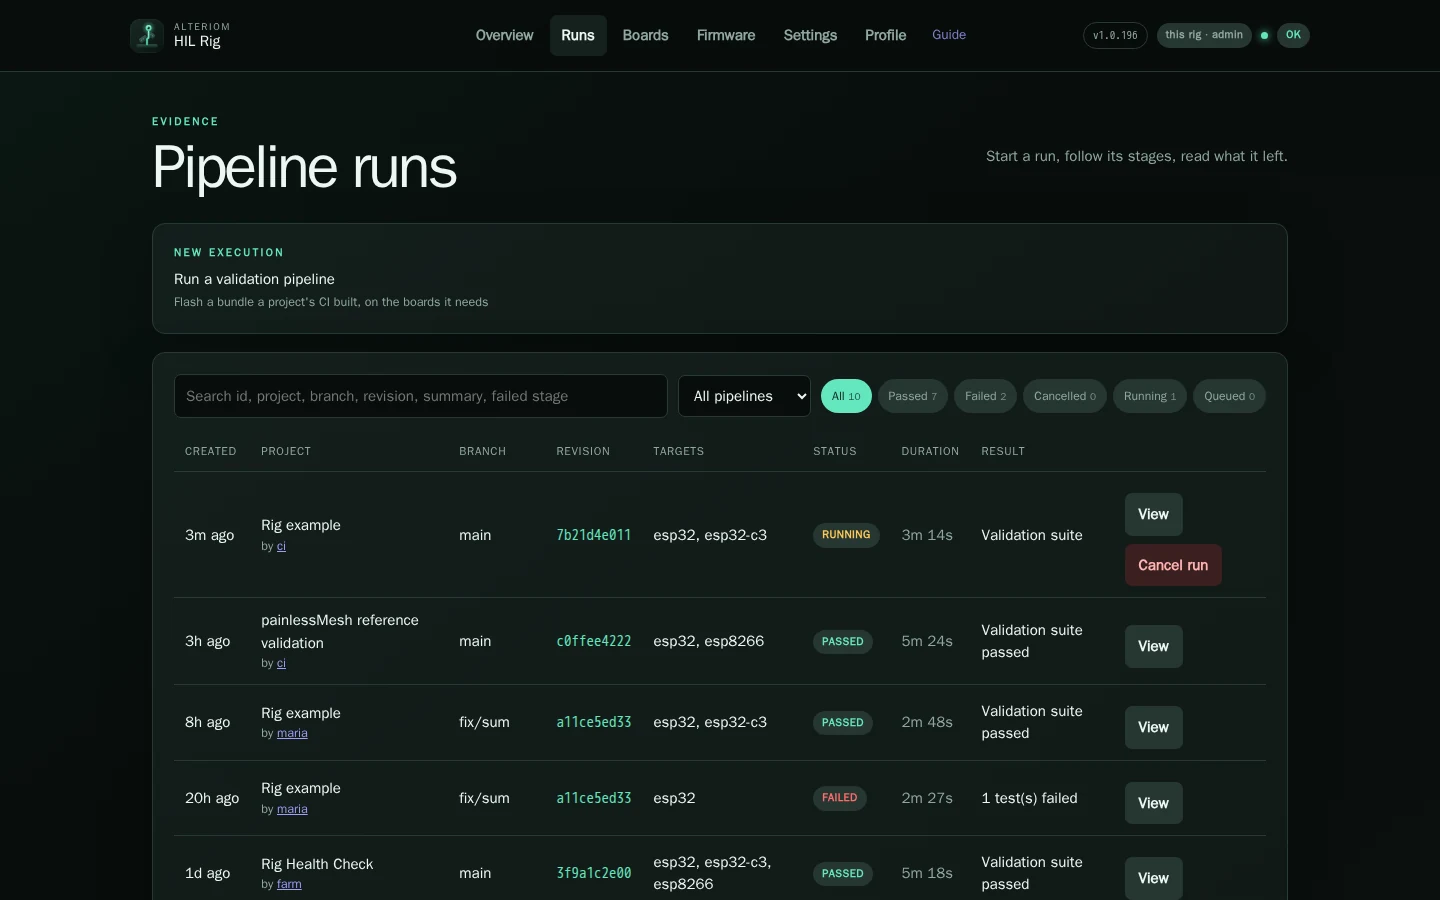
Every run the rig has made. Each row says what it was for, the branch and commit, the boards' families, the verdict and how long it took, and who asked: the key or account it came from. That name is a link to its profile. Search by id, project, branch, commit or failed stage; filter by status.
A run: the pipeline and the evidence
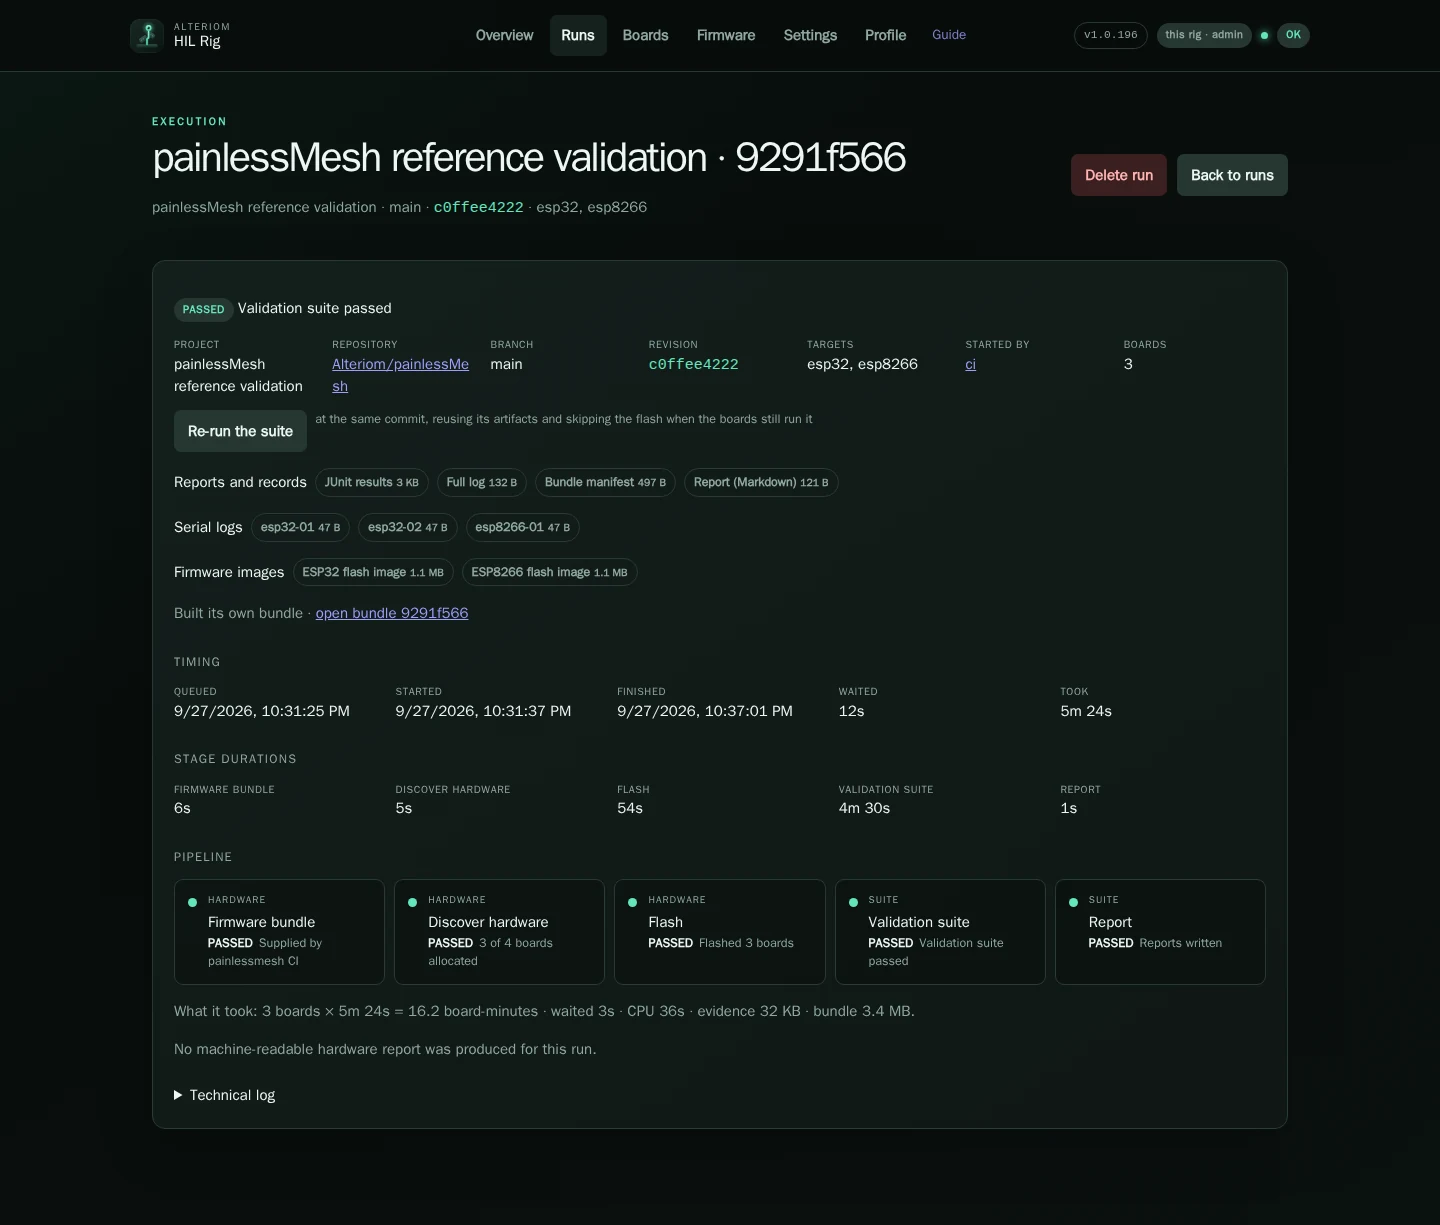
One run, start to finish. At the top, the verdict and the facts behind it: project, repository, branch, commit, targets, who started it and how many boards it held. Then the evidence, each file downloadable: JUnit results, the full log, the bundle's manifest, the report, one serial capture per board and the firmware images that were flashed. Timing and Stage durations say where the minutes went; What it took is the run's meter: boards times minutes, CPU, and the bytes it kept.
A failed run reads the same way, with the failing stage marked and its failure text up front.
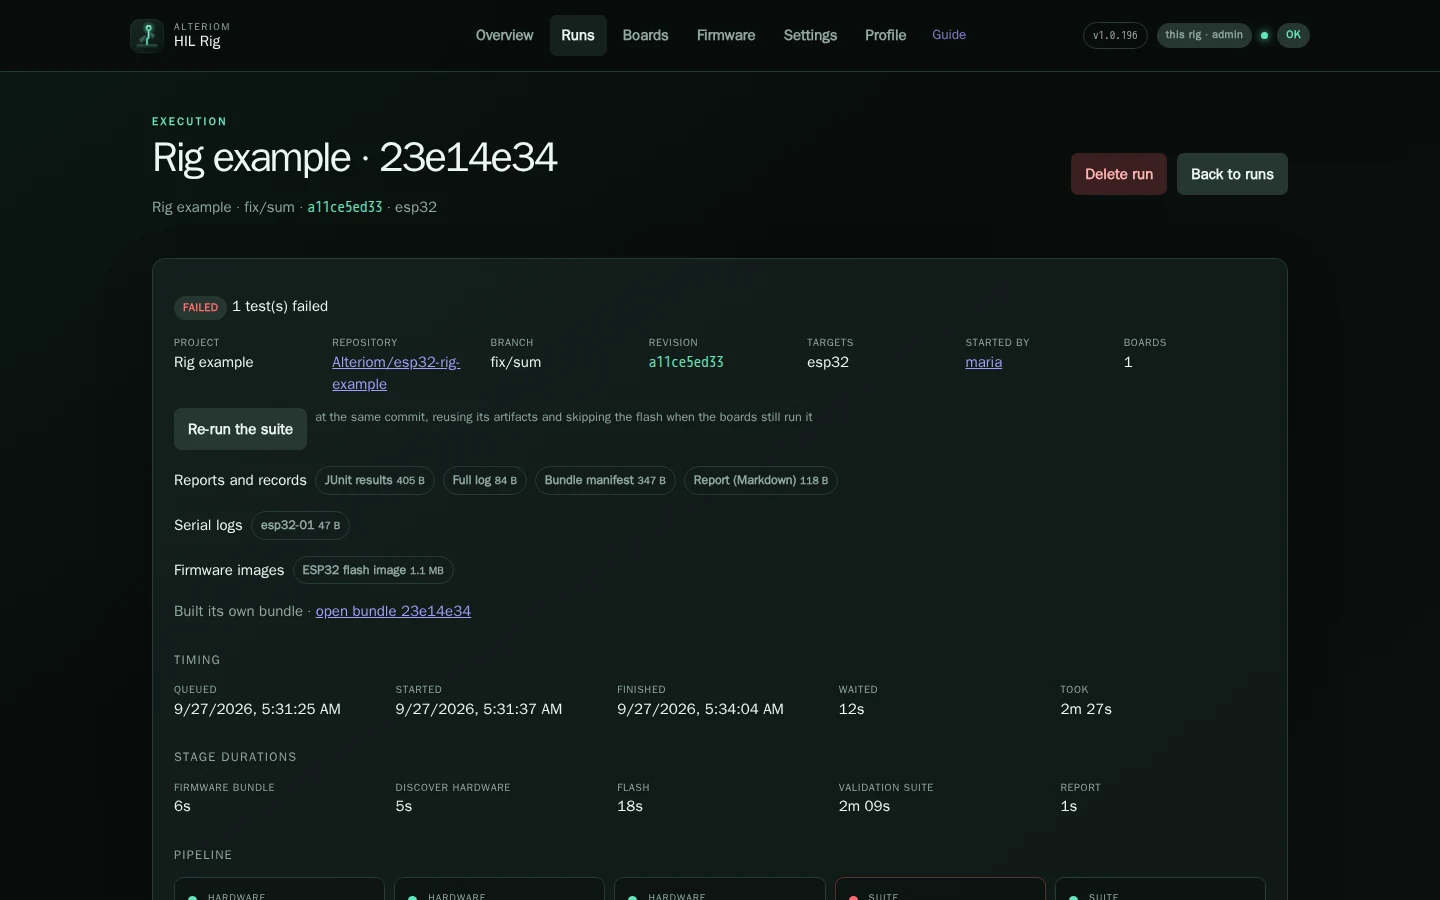
Re-run the suite runs it again at the same commit, reusing its bundle and skipping the flash when the boards still run it.
Boards: what is on the hub
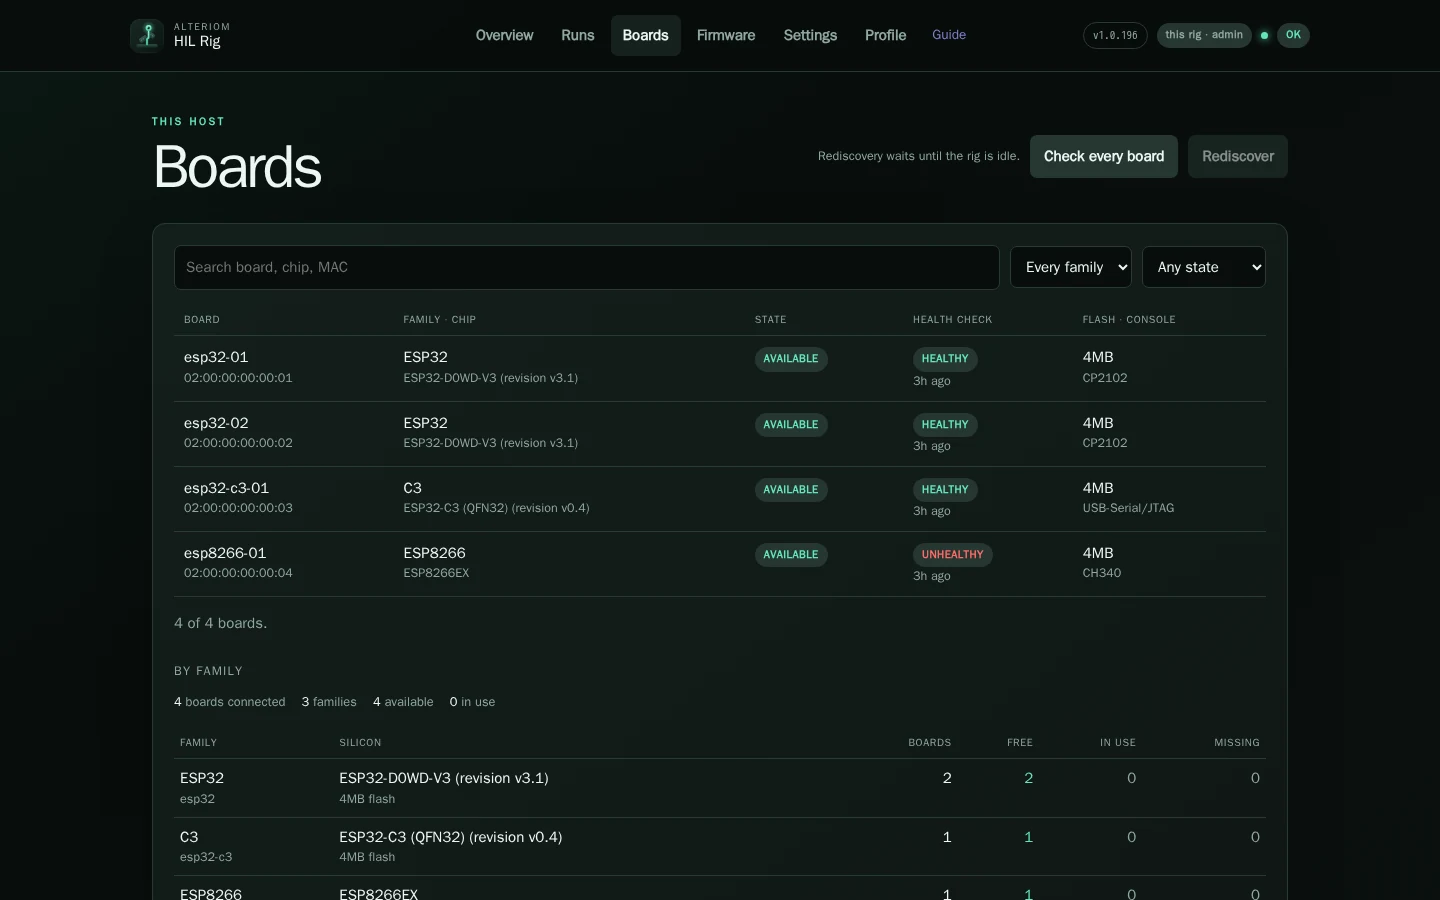
Every board the rig knows: its name and MAC, its family and the chip it reported, whether it is free or held by a run, its last health check verdict and when, and its flash and USB bridge. Here the ESP8266 failed its radio check; it stays out of runs until a check passes again. Check every board runs the Rig Health Check; Rediscover reads every port again once the rig is idle. Below, the same boards by family.
Firmware: the bundles the rig holds
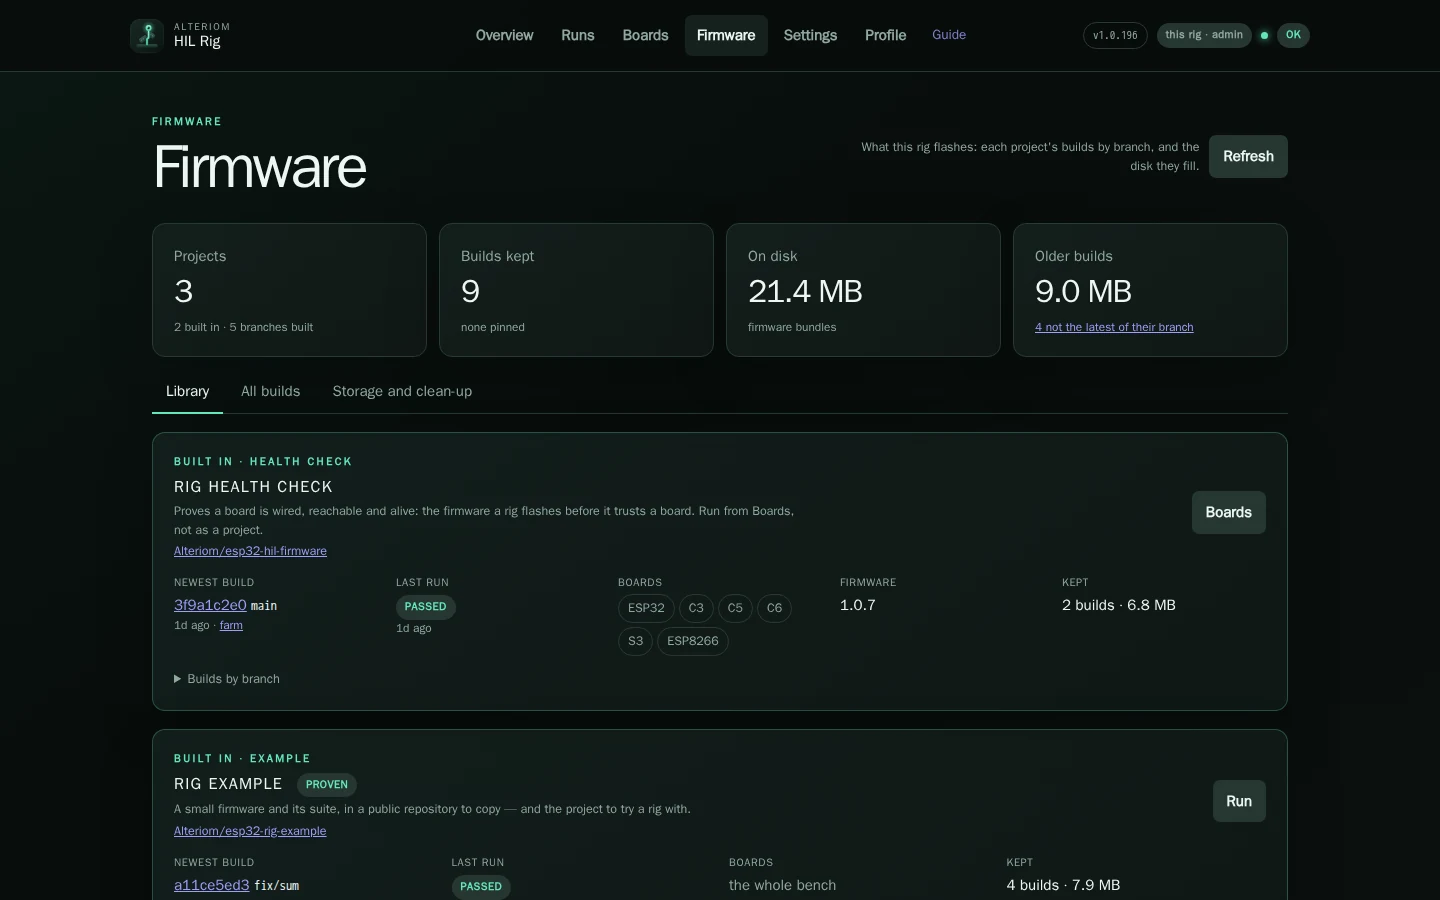
What the rig flashes, by project: the newest build of each branch and who it came from, the last run on it, the families it holds, and how much it keeps on disk. The health check's firmware arrives with each release. All builds lists every bundle; Storage and clean-up says what a prune would free and does it.
Statistics: how the rig has been doing
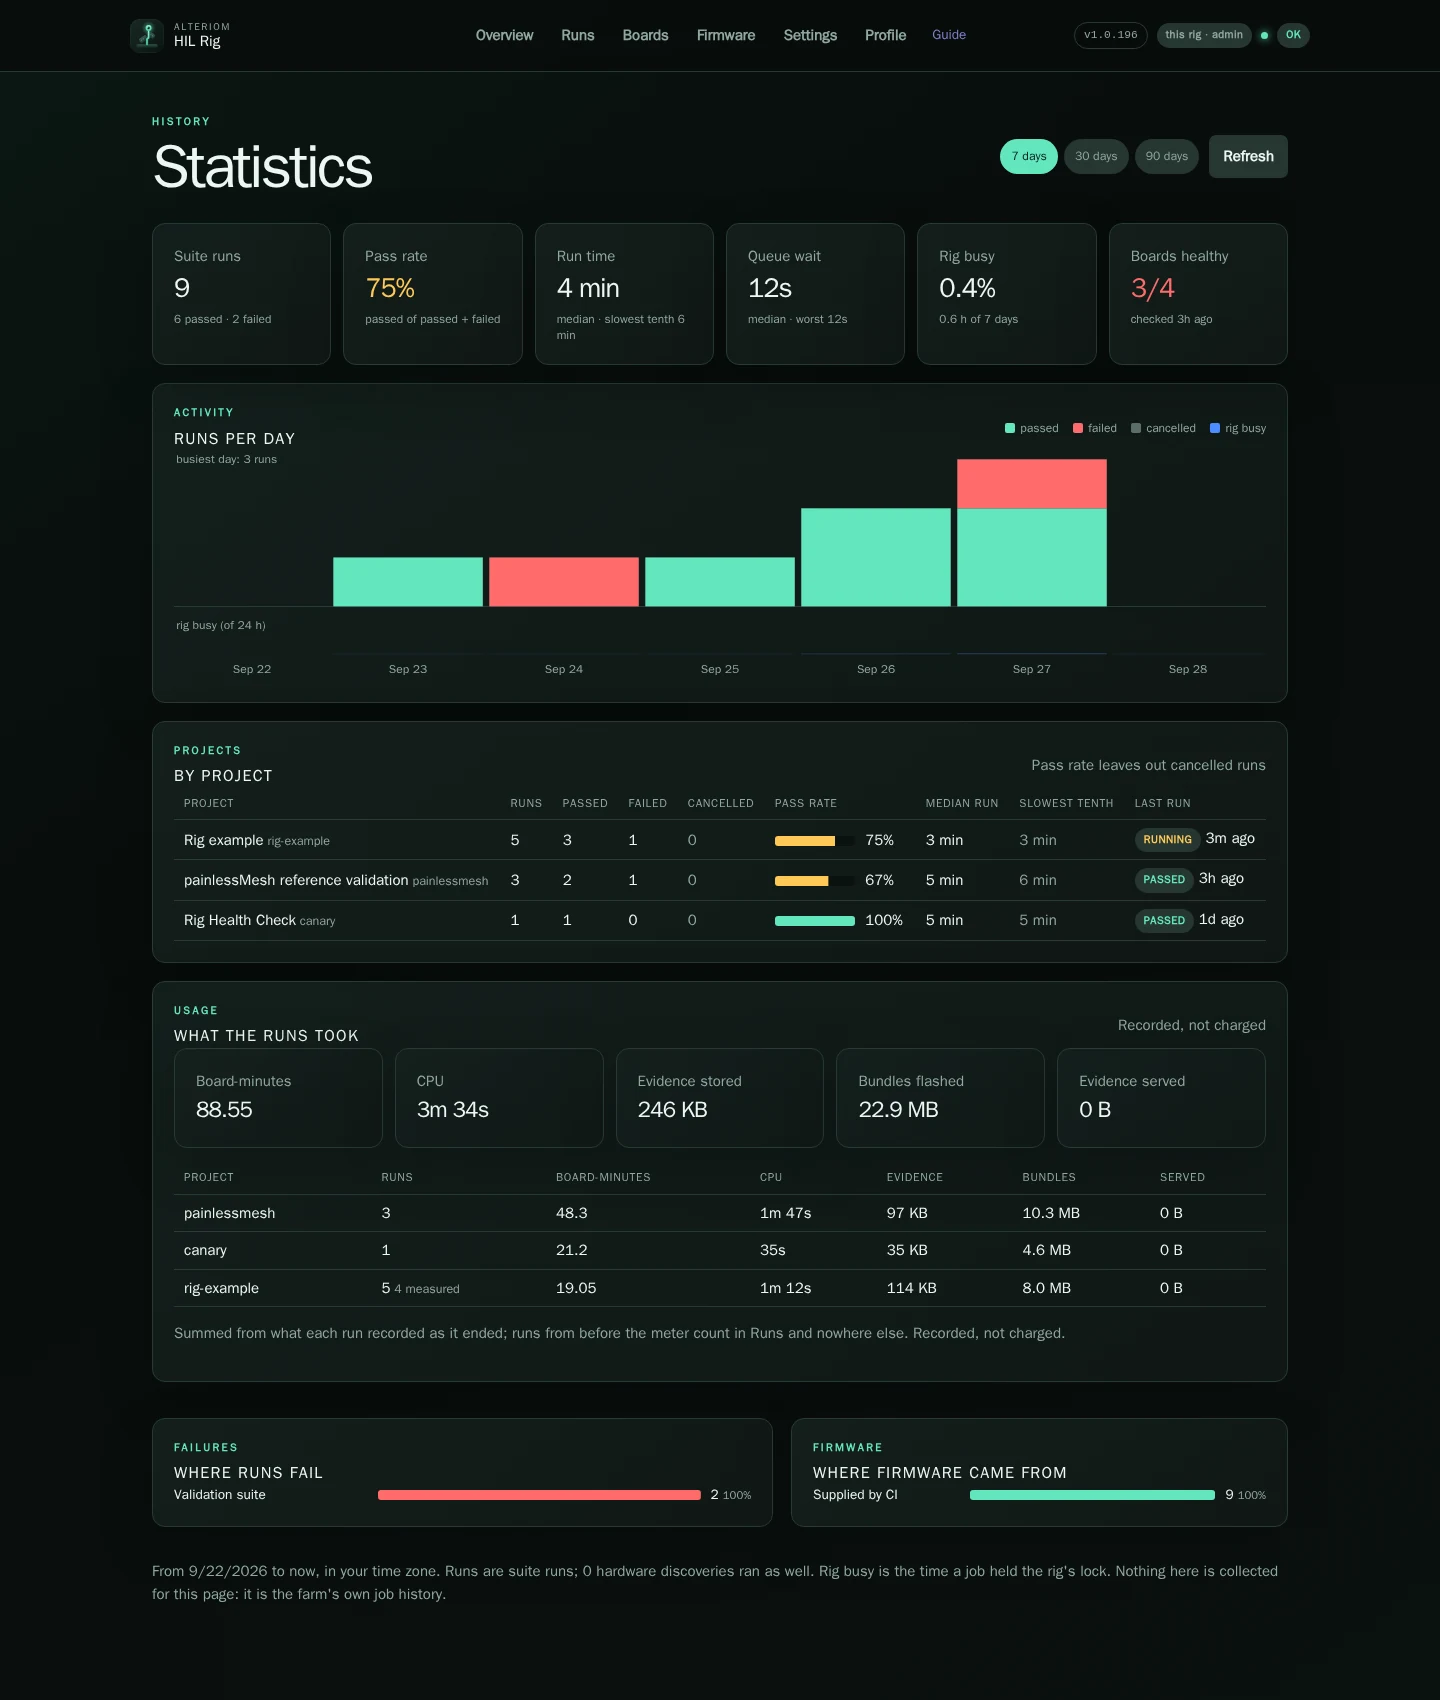
Seven, thirty or ninety days of the rig's history: runs per day by verdict, each project's pass rate and run times, what the runs took in board-minutes, CPU and storage, which stage failures come from and where the firmware came from. It is computed from the rig's own job history; nothing is collected for it.
Profiles: who asked, and what they ran
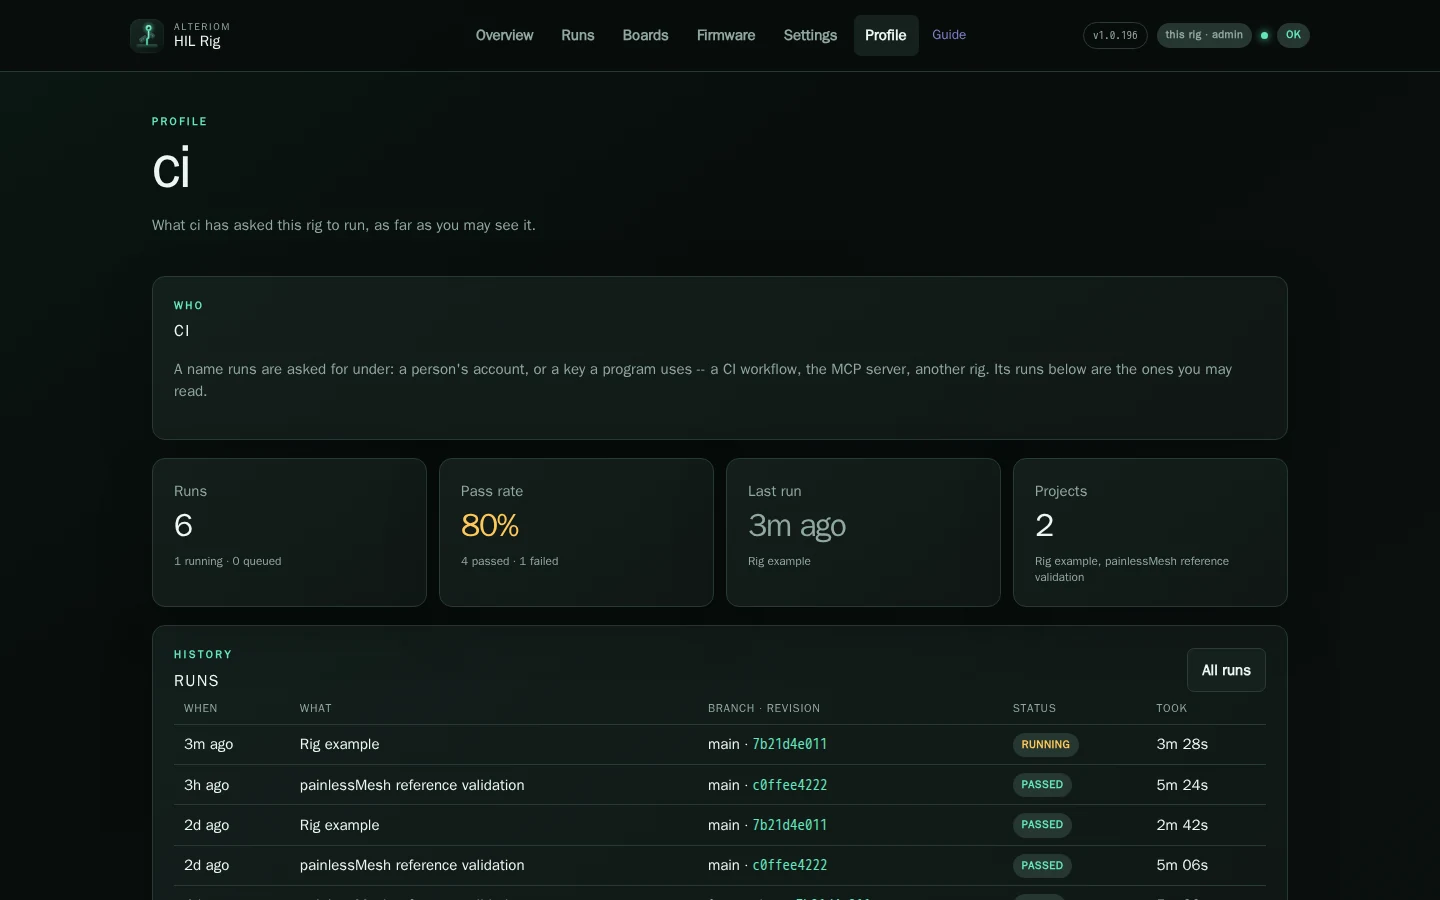
Every name a run was asked for under has a profile: a person's key, a CI's key, a farm's account. It shows that name's runs as far as you may see them, its pass rate, its last run and the projects it ran. Reach one from the by link on any run.
Profile in the header is your own: who the rig says you are, your role and what it lets you do, how you signed in, and your runs.
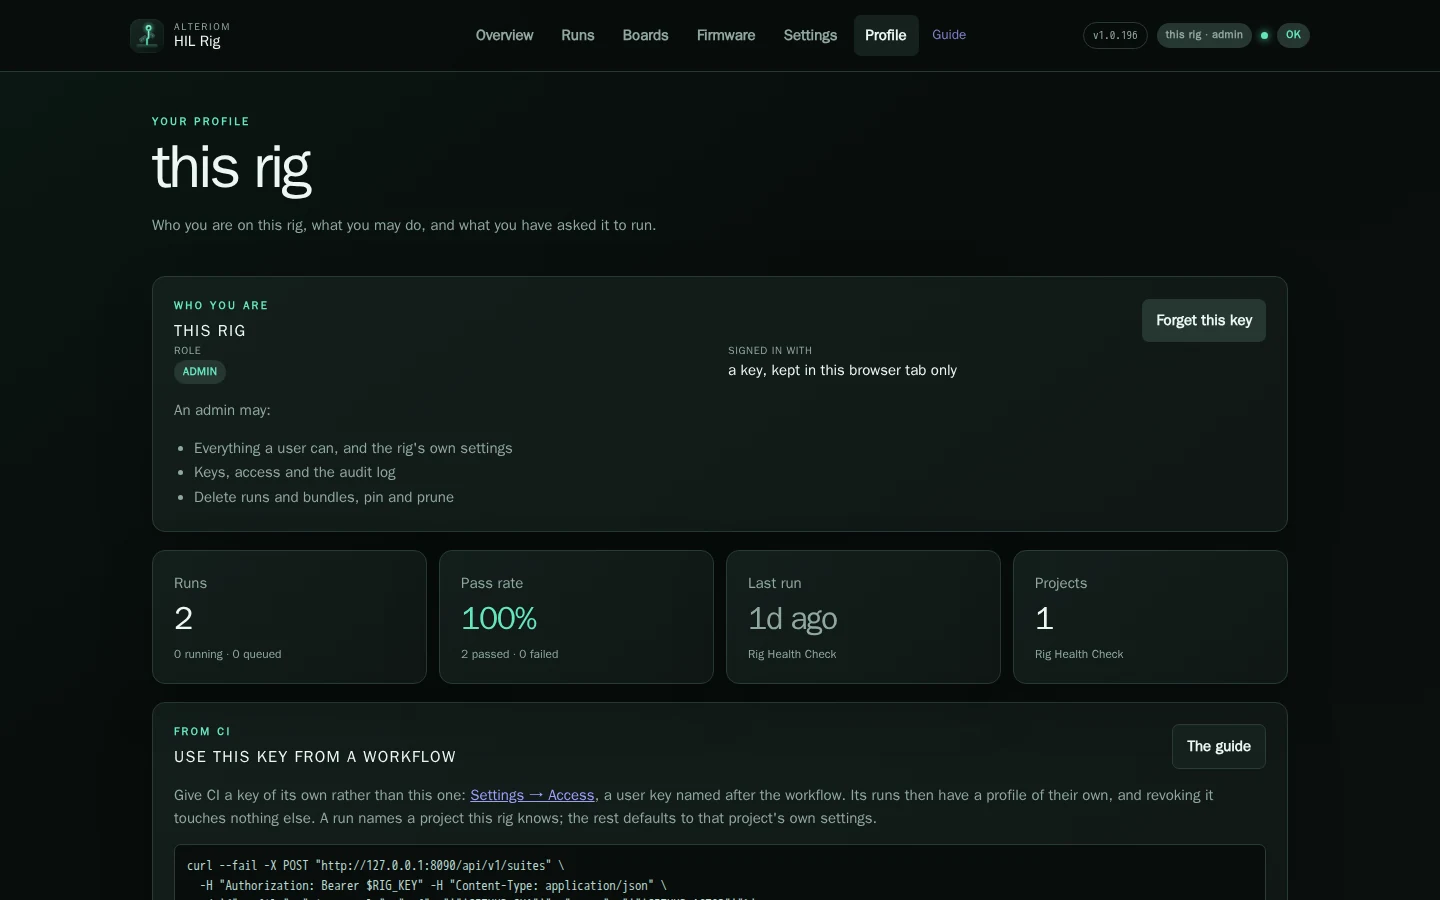
With a key, it also has Use this key from a workflow: the exact request a
CI job sends to run a suite, with this rig's address filled in. Give each CI
its own user key from Settings → Access rather than the rig's admin key:
its runs then have a profile of their own, and revoking it touches nothing
else. Projects and your CI has the whole workflow.
Settings
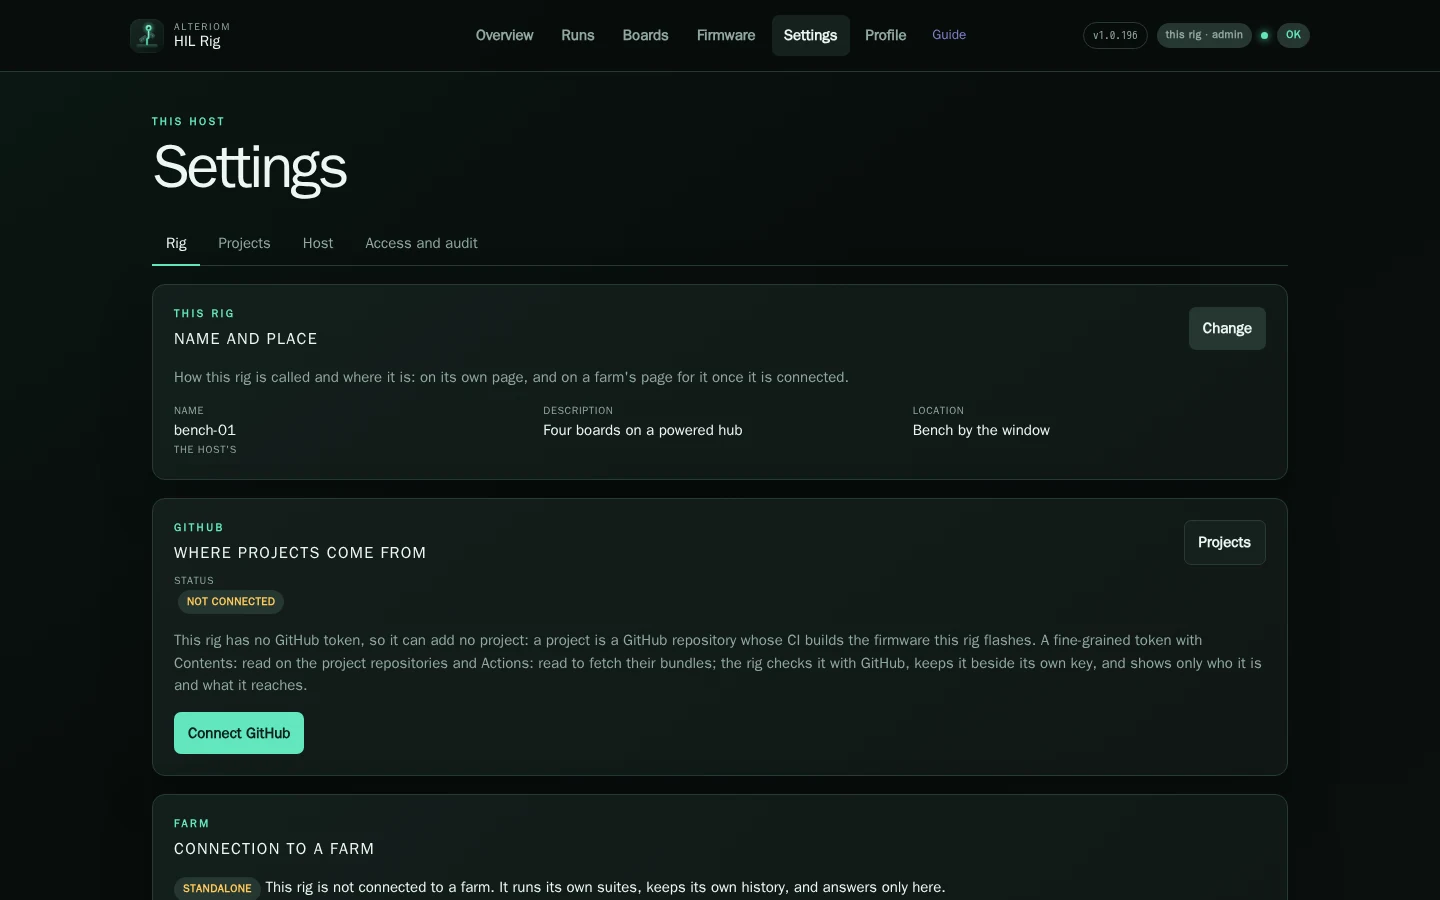
Four pages: Rig (its name and place, GitHub, a farm, the software), Projects, Host and Access and audit. The dashboard says what each setting does.
On a phone
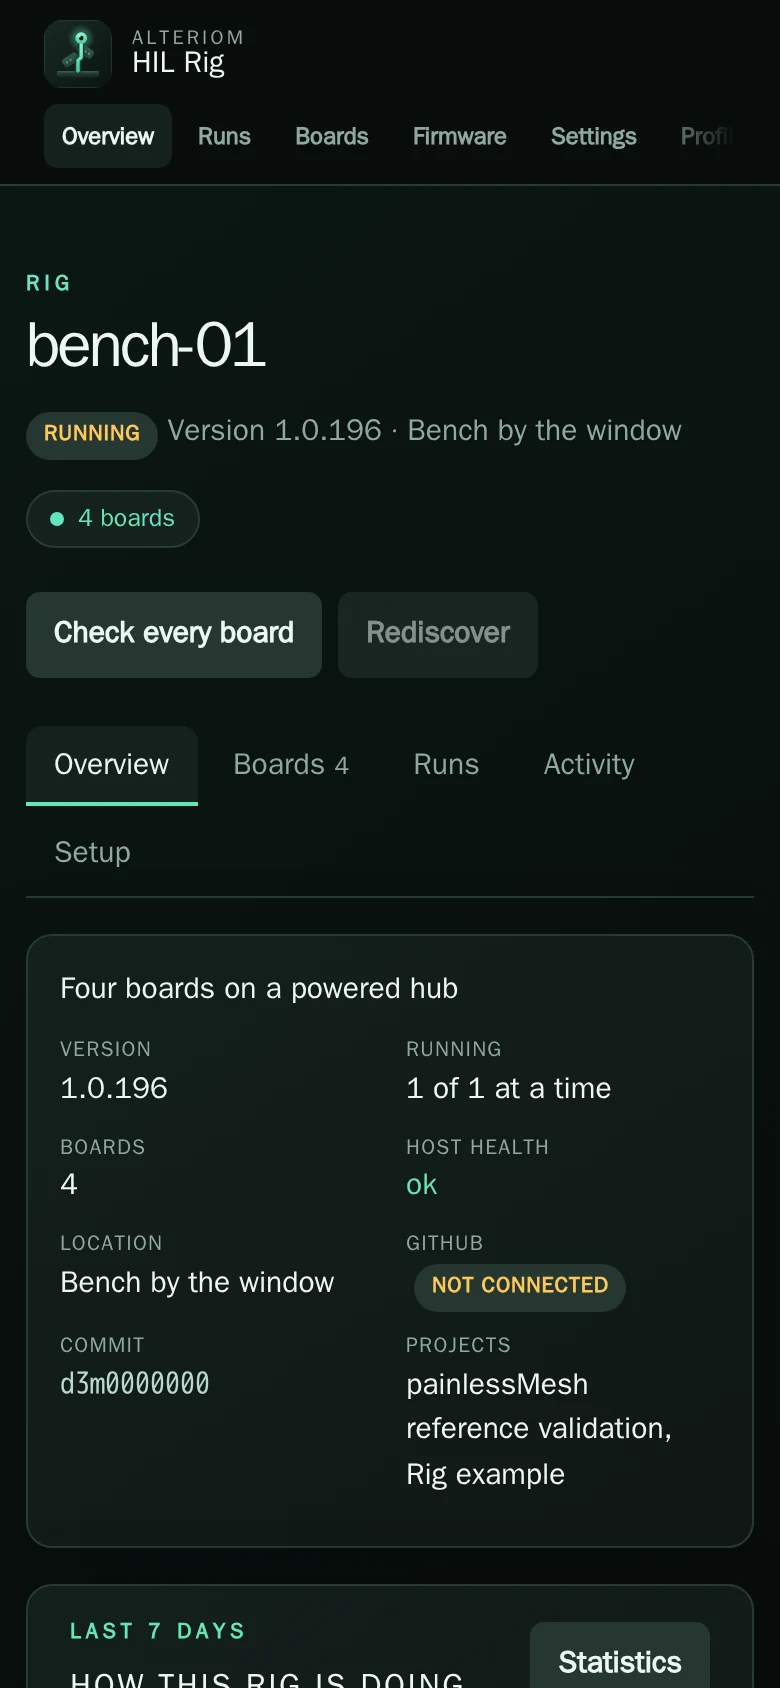
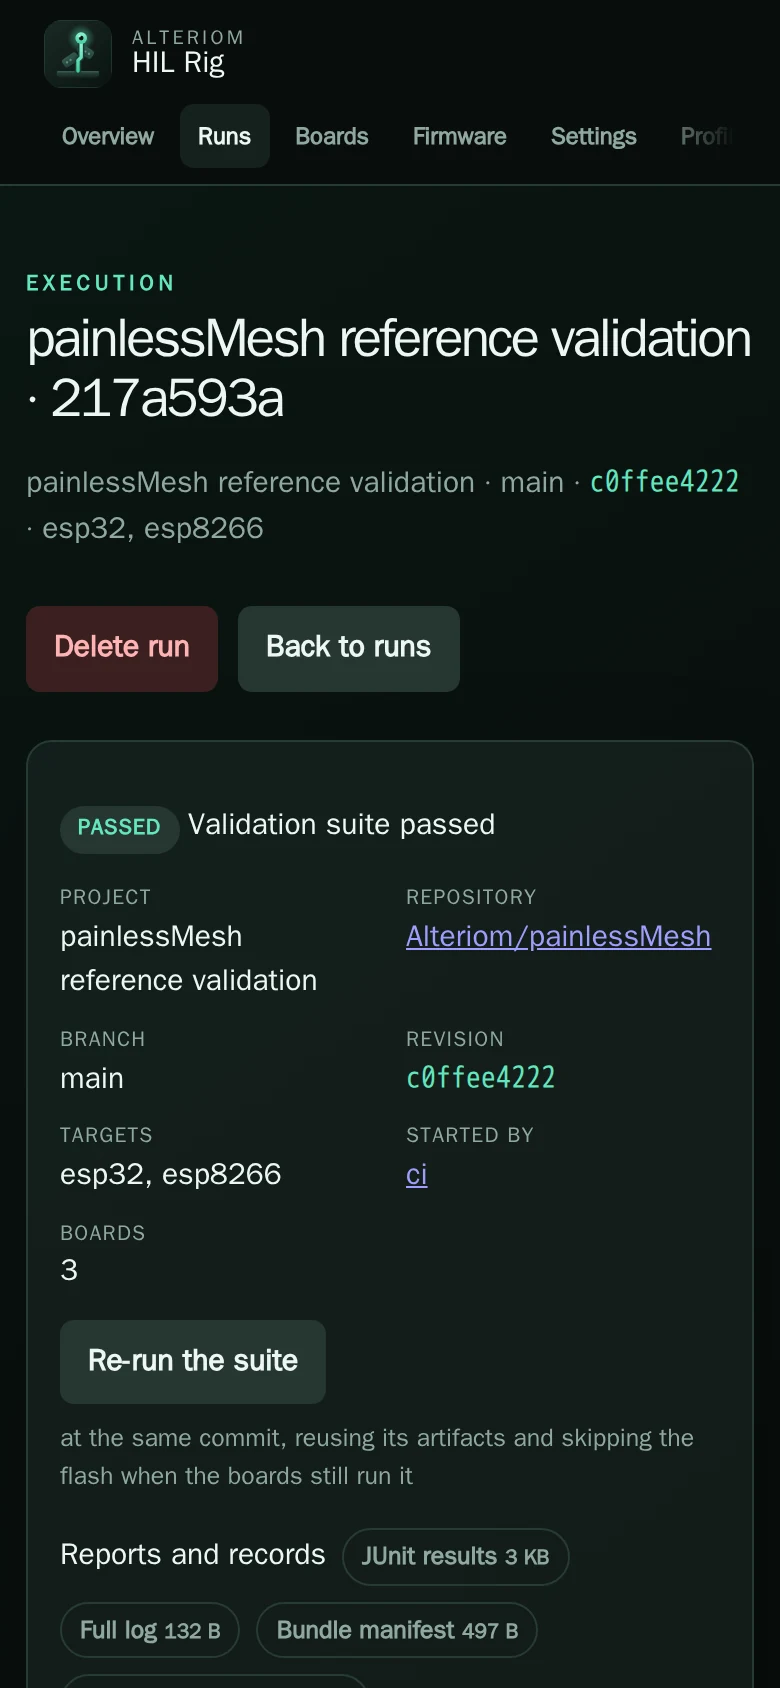
The same pages at phone width: the menu scrolls sideways, facts stack in two columns and a page's buttons move under its title.
How these pictures are made
The pictures are taken by a script, of a demo rig, so they can be taken again
after any change to the dashboard. The demo is the real service on a state
directory written by runner/screenshots/demo_rig.py; nothing in it touches
hardware. runner/screenshots/README.md has the recipe.